
Data Platform and Dashboards for a Finance Provider
Four source systems consolidated into one warehouse with automated quality checks on every load
System workflow
- Regional financial services provider
- Data Platform
- Jakarta, Indonesia
- January 20, 2026
Screenshots
The image could not be loaded.
The image could not be loaded.
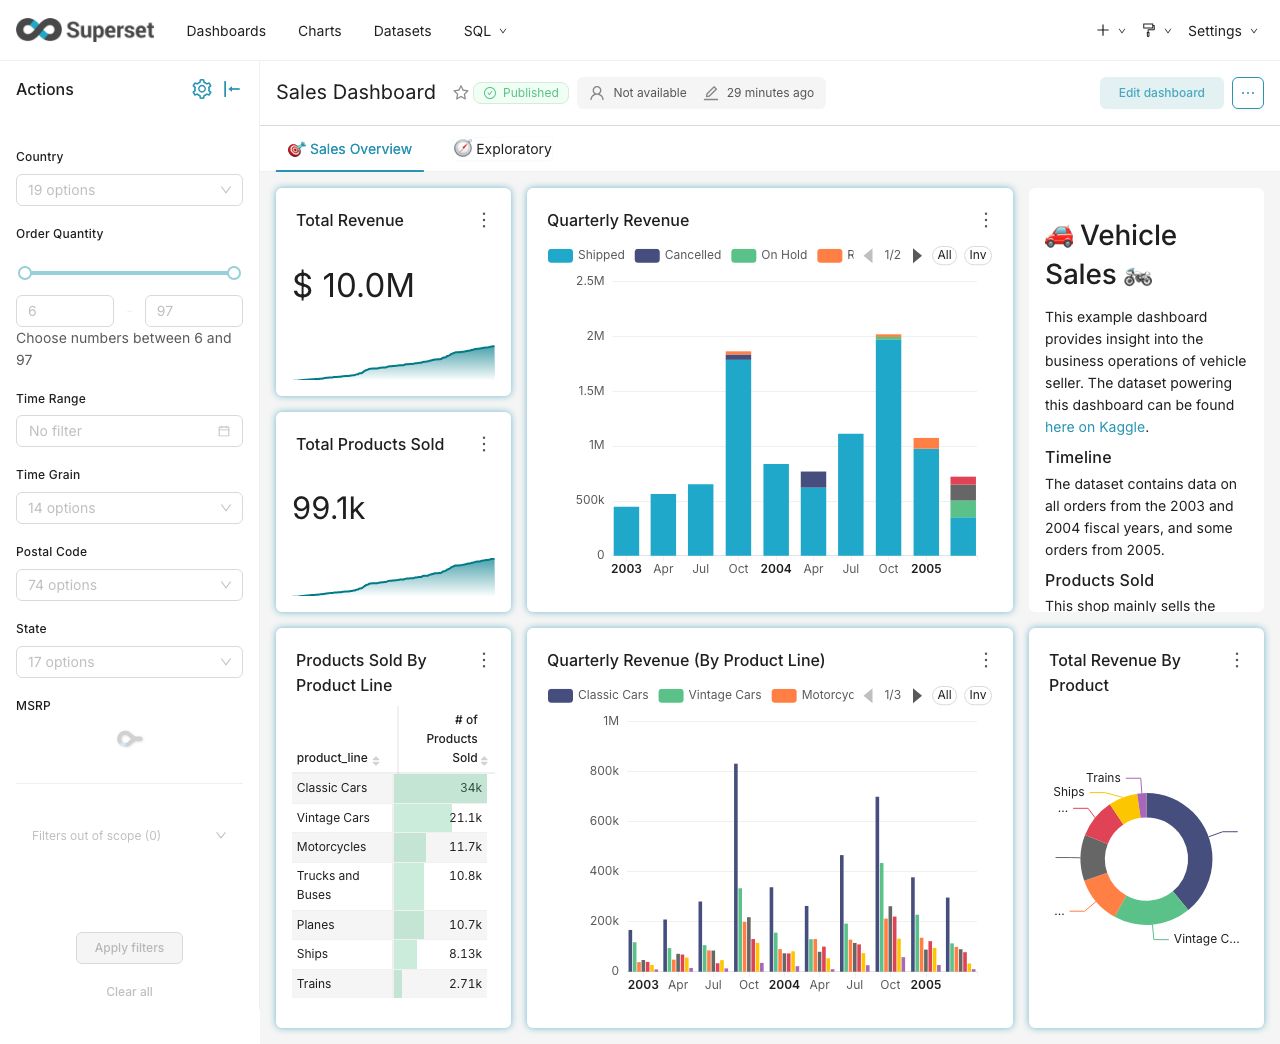
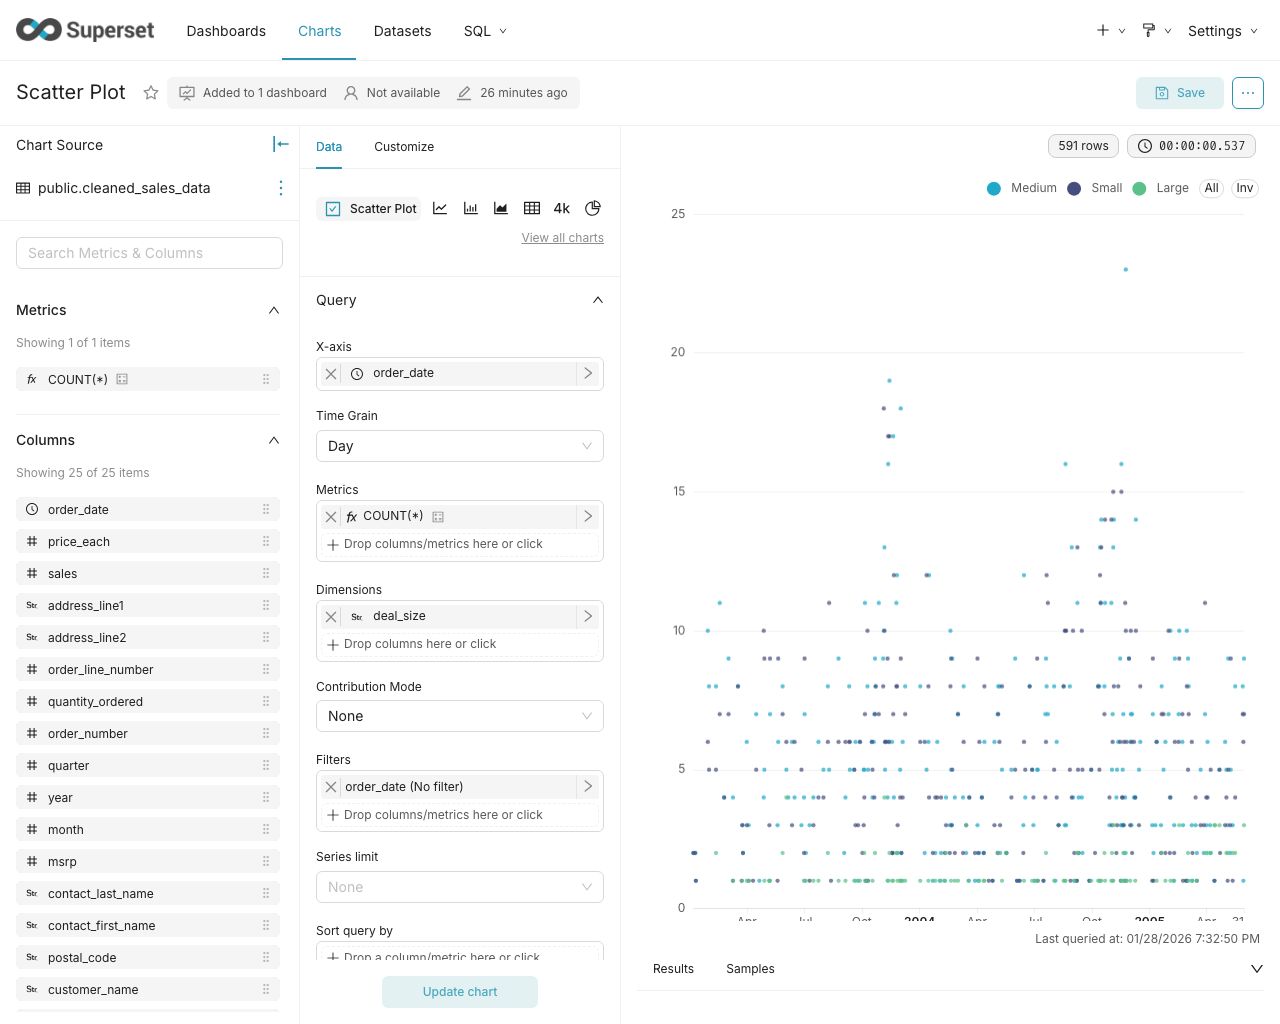
Placeholder images from the public Apache Superset demo. Not screenshots of the client's project.Image source ↗
How the system works
Four data sources feed one warehouse and a shared metric-definition layer for operational dashboards.
Source systems
Four existing sources
- Core system
- CRM
- Accounting
- Vendor export
Scheduled ingestion
Retries, partial loads, and alerts
Warehouse & models
Metrics as code; checks on every load
Operational dashboards
Team views on the same models
Quality is checked on every load. Failed loads stop and alert rather than flowing into reports.
⚠ This case study is anonymised under a non-disclosure agreement. The client name, logo, and all business figures are not published. What is described below is the engineering scope of the work.
The problem
The daily operational report was assembled by hand every morning from four separate systems: the core system, the CRM, an accounting tool, and one export from an external vendor. The same number was defined differently in each system, so meetings often turned into an argument about which report was right rather than about what to do.
What we built
- Ingestion layer. Scheduled pipelines pulling from all four sources, with retries, partial-load handling, and alerts when a source is unavailable.
- Warehouse and modelling layer. One central schema with metric definitions written as code, so “active customers” has a single definition anyone can read.
- Data quality checks. Tests on every load: key uniqueness, plausible value ranges, and row count reconciliation against the source system. A failing load stops and alerts rather than continuing quietly.
- Operational dashboards. Six views for different teams, all built on the same modelling layer.
Engineering decisions
The hard part was not the pipelines, it was agreeing the metric definitions. We ran a series of short sessions with each system owner until every metric had one written definition, then implemented those definitions as reviewed code rather than as a formula inside a dashboard that anyone could change.
All infrastructure is written in Terraform, so staging is identical to production and either can be rebuilt from nothing.
Handover
The repository, the Terraform configuration, the metric definition catalogue, and the recovery runbook were handed to the client’s data team, along with one recorded knowledge transfer session.
Related work


Does your team face a similar problem?
Tell us about the workflow and its constraints. We start with a scope we can describe and verify.